ThePolishAviator
ACCESS: Restricted
- Joined
- 29 January 2021
- Messages
- 17
- Reaction score
- 16
Hello,
recently I read a study titled "Design of high lift airfoils with a Stratford distribution by the Eppler method" by Mr. W. G. Thompson. This study uses a special program to design an airfoil with a peculiar pressure distribution.
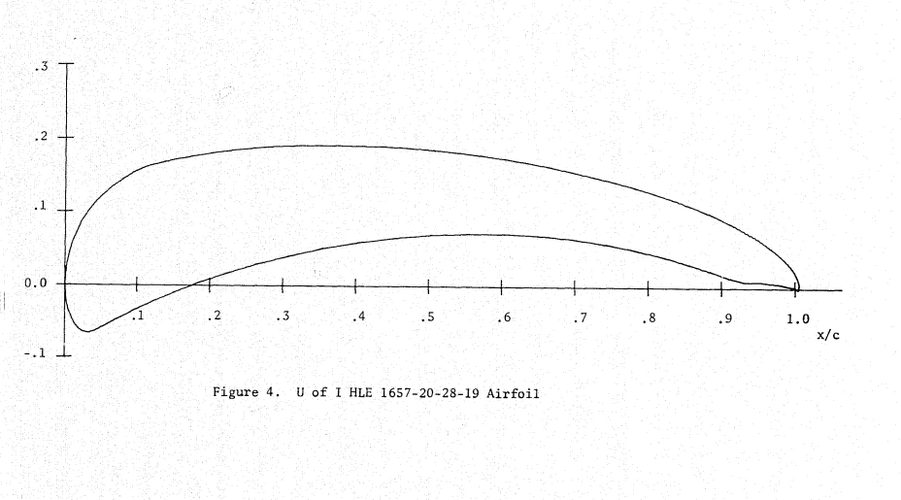
This is one of the results of that study:

I was very interested in this airfoil as quoting: "-an airfoil labelled 1640-20-34-21 indicates an airfoil with a design free stream Reynolds number (based on the chord length) of 1.6 million, a design Cl of 4.0, boundary layer transition at chord length .20, a critical Mach number of .34, and a thickness of 21 percent."
While this isn't the exact airfoil pictured above they are very similar and the differences are not relevant to my questions.
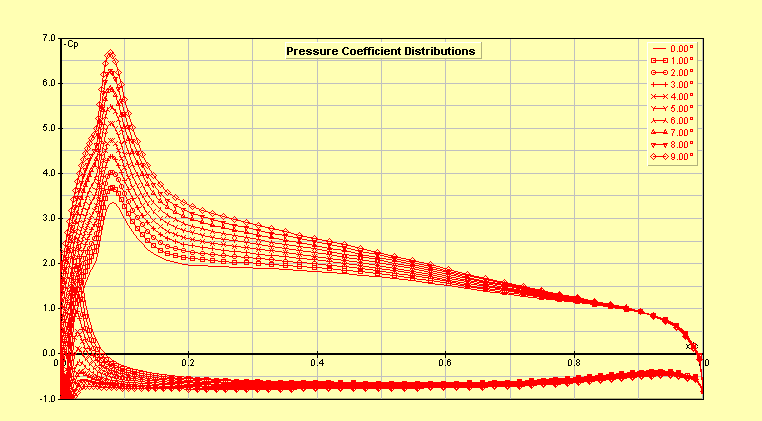
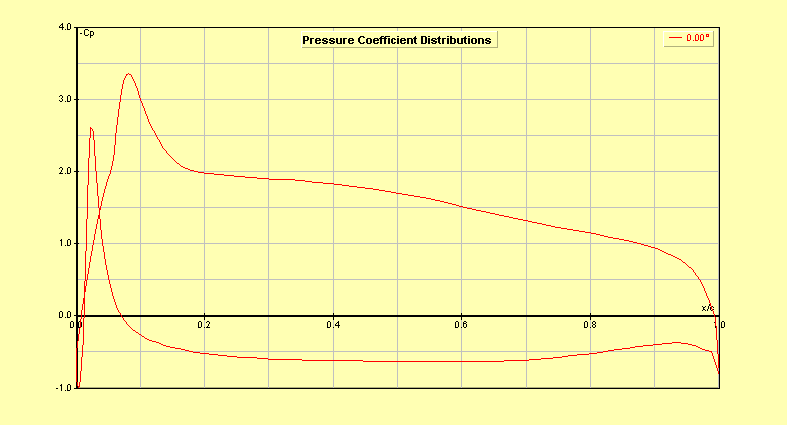
When I read the claim of a 4.0 Cl I was very skeptical so I decided to run some simulations. I made a copy of that airfoil in a program called XFLR5 by overlaying a semi transparent image from the study and eyeballing the airfoil I was making to look as similar as possible and I think I did a very good job. After that I imported the .dat file into JavaFoil and ran a pressure distribution simulation at the conditions mentioned in the stude (Re of 1.6 million and 9.75 degree AoA) and then my questions started.
The result:

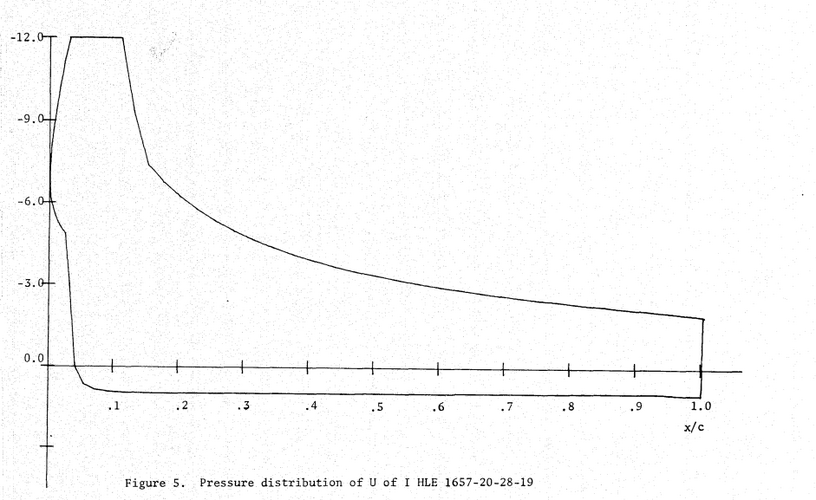
compared to the graphs in the study

the difference is pretty clear.
Not only is the pressure distribution different in shape but also in magnitude being barely half as high as the original. JavaFoil also indicated a Clmax of 3.2 (while the exact Clmax of that airfoil wasn't mentioned in the study I believe it should be at least a little bit higher). My attempts to smooth out the airfoil and change it manually only made the results worse while other airfoil analysis programs indicated very very wild results (I used a Liebeck L1003 airfoil as a benchmark to test the accuracy of other programs and some indicated a Clmax of 12.0 which was why I used JavaFoil).
Is there a flaw in my methodology or is the program at fault? Maybe the airfoil is extremely sensitive to tiny changes and me eyeballing it's shape (I think I got a 2% tolerance at worst and less than 0.5% in most places) was the reason for the weird results? Can someone perhaps recommend a more accurate program that will give me better results?
recently I read a study titled "Design of high lift airfoils with a Stratford distribution by the Eppler method" by Mr. W. G. Thompson. This study uses a special program to design an airfoil with a peculiar pressure distribution.
This is one of the results of that study:

I was very interested in this airfoil as quoting: "-an airfoil labelled 1640-20-34-21 indicates an airfoil with a design free stream Reynolds number (based on the chord length) of 1.6 million, a design Cl of 4.0, boundary layer transition at chord length .20, a critical Mach number of .34, and a thickness of 21 percent."
While this isn't the exact airfoil pictured above they are very similar and the differences are not relevant to my questions.
When I read the claim of a 4.0 Cl I was very skeptical so I decided to run some simulations. I made a copy of that airfoil in a program called XFLR5 by overlaying a semi transparent image from the study and eyeballing the airfoil I was making to look as similar as possible and I think I did a very good job. After that I imported the .dat file into JavaFoil and ran a pressure distribution simulation at the conditions mentioned in the stude (Re of 1.6 million and 9.75 degree AoA) and then my questions started.
The result:

compared to the graphs in the study

the difference is pretty clear.
Not only is the pressure distribution different in shape but also in magnitude being barely half as high as the original. JavaFoil also indicated a Clmax of 3.2 (while the exact Clmax of that airfoil wasn't mentioned in the study I believe it should be at least a little bit higher). My attempts to smooth out the airfoil and change it manually only made the results worse while other airfoil analysis programs indicated very very wild results (I used a Liebeck L1003 airfoil as a benchmark to test the accuracy of other programs and some indicated a Clmax of 12.0 which was why I used JavaFoil).
Is there a flaw in my methodology or is the program at fault? Maybe the airfoil is extremely sensitive to tiny changes and me eyeballing it's shape (I think I got a 2% tolerance at worst and less than 0.5% in most places) was the reason for the weird results? Can someone perhaps recommend a more accurate program that will give me better results?

