marauder2048 said:
Your observation was:
Today's expenditures are about $7.6 billion in the nuclear weapons category (out of $18.7 billion total budget), which in constant dollars is more than we spend in 1989.
Except that chart you use to support that argument includes a new agency whose administrative and overhead costs are part of the post 2000 budgetary history making historical comparisons back to 1989 difficult.
Arian said:
The confusion is that your original argument was about weapons procurement, which is why you're comparing it here with the DoD's weapons procurement budget. Not total operating costs of all weapon systems!
bobbymike said:
The amount we actually spend on weapon systems is such a small percentage of the federal budget and especially the national economy. Around $120 billion out of $4 trillion (3%) or out of $18.2 trillion (6/10ths of 1%)
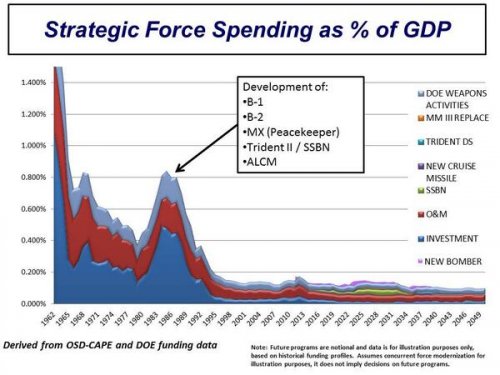
Interesting as a percentage of the economy the nuclear weapons budget from the 80's would be roughly $170 billion/annum today more than we spend in total on all weapons.
So the 0.9% of GDP peak, was never about nuclear weapons procurement/R&D/testing. It may be for all operational expenses of the force. The charts I'm giving are for the former.
Operating expenses are obviously going to go down, because that's the intended aim. When you move from Atlas ICBM to Minuteman III ICBMs, your operating costs are going to collapse. That's the idea.
I'm not comparing agency budgets at all. I'm getting my data from http://www.usgovernmentspending.com They have a category for "atomic energy defense activities", under which there is a heading "weapons activities". For FY2015 it is $7.6 billion. That's the "weapons activities" segment of the NNSA. That stuff would have been under different agency's budgets before, but that doesn't prevent us from comparing.
That particular chart is adding similar line items from previous budgets, regardless of which agency they fell in. How well they are doing it, it's not for me to defend. I'm just giving you what the chart says. Show us something better, if you disagree!
That's not how overhead rates are calculated.
That would depend on the definition of overhead.
You're still talking warheads nuke enterprise only. Current total force cost including modernization is $1 trillion over 30 years or $33 billion/annum.
I'm looking at the line items which talk about "weapons activities". It's not warheads only. Total force costs is a different thing.
My figure comes from a chart retired General Kowalski former head of Stratcom that showed 80's spending on nuclear systems peaked at roughly 0.9% of GDP. BEA states today's GDP at $18,230 billion X 0.009 equals $164 billion. Sorry the in my head estimate was off a bit.
There very well may have been a time when total expenditures on all nuclear-related activities were 0.9% of GDP. But it wasn't in the 1980s. It may have been in the 1960s. So by that definition, even the 1980s represented a significant reduction in %/GDP over the 1960s.
Also, that depends on what is covered under all those programs. As I said, the current budget (FY2015) is $18.7 billion dollars for all nuclear weapons related activities. But only $7.6 is related to actual weapons development or procurement. So maybe that 0.9% of GDP also includes all sorts of other things as well besides simply weapons programs.
Additionally, some things fall under different budgetary headings. There's weapons development and procurement. Then there's maintenance and operations of weapons, which fall under a different category and different Department. For example. CBO gives different figures from those found in other sources, probably because they include the costs of operation and maintenance of these weapons. Here is CBO projections: https://www.cbo.gov/publication/49870
I'll include a screenshot of their table for people who don't have Excel.
So it's $7 billion for subs in FY2017 in the CBO table, it was $1.8 billion for SSBN-X in FY2017 in my previous post. So we either include just the R&D+procurement, or the total costs of operating the whole fleet of current Ohio class subs. $18.7 billion is the number given by the CBO for FY2015, which is also the number given by http://www.usgovernmentspending.com that I gave earlier. Within this, there's a bunch of stuff, $7.6 billion is "weapons activities" related to R&D and procurement, which falls under a separate line item in the NNSA budget (but is aggregated with other items in this CBO list)
So, what was that 0.9% of GDP peak comprised of? Not so clear what the actual expenditures are even today. But we want to get an apples to apples comparison, and that chart is the closest I could find to it (you're free to find something better!)
PS: According to what I could find for FY2016, the weapons activities item request was $8.8 billion, and FY2017 request is $9.2 billion.
PPS: Brookings gives similar data: http://www.brookings.edu/about/projects/archive/nucweapons/rdt
Expenditures for U.S. Nuclear Weapons Research, Development, Testing, and Production, 1948-1998
As you can see it's basically the same as the previous chart (but in different constant dollars, and ends in 1998)


